Gartner
SciCord Recognized in the Gartner Market Guides for LIMS and ELN
SciCord Recognized in the Gartner Market Guides

Check out the 2025 LIMS & ELN Buyer’s Guide
Check out the 2025 LIMS & ELN Buyer’s Guide
Check out the 2025 LIMS & ELN Buyer’s Guide
Chromatography is a powerful analytical tool that is widely used in the pharmaceutical industry for the separation and analysis of various compounds. However, chromatography can require complex calculations and generate large amounts of data, making data management a challenging task.
Significantly improve the efficiency of your chromatography data management process by automating the data collection, calculations, review, and analysis.
Your Informatics Platform provides tools for documenting samples to be tested, referencing standards & solutions, recording instruments, columns, and methodology of the chromatography analysis.
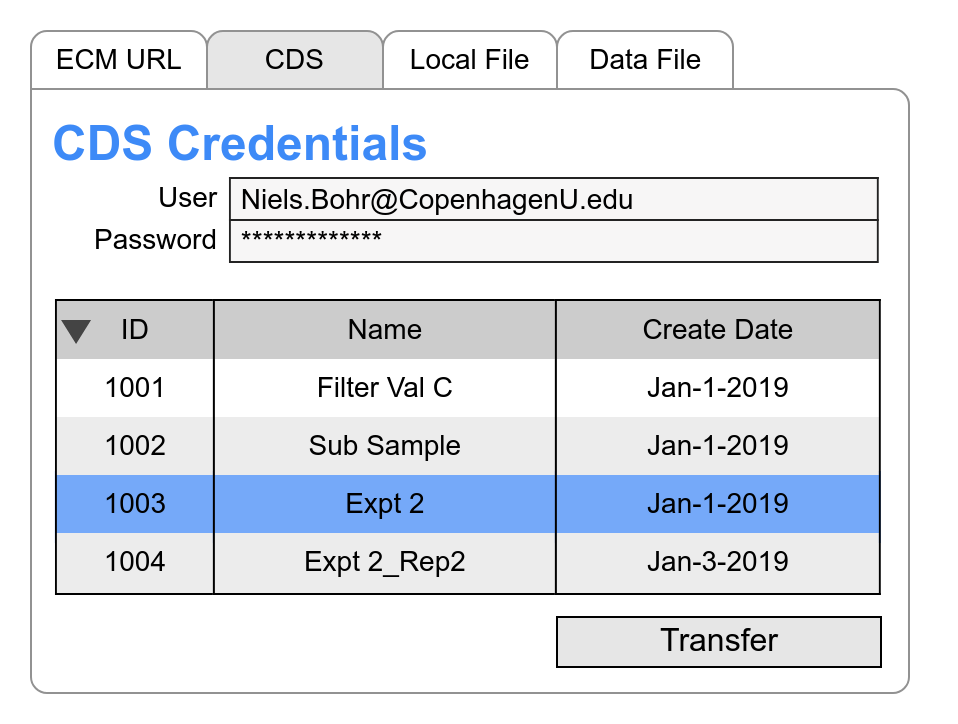
The injection sequence is defined by the Informatics Platform based on the type of analysis, compliance requirements, samples, standards, QCs … The injection sequence can be transferred to the chromatography system using various file formats or copy/paste.
Integrated sequence data is imported into the Informatics Platform through techniques dependent on vendor.
Chromatography systems typically have calculation engines built in to calculate concentrations or other result from the underlying area count data. The Informatics Platform can perform additional validated calculations, data grouping, and suitability if necessary. The goal is to have all data reduction automated & validated.
The Informatics Platform can provide comprehensive review and approval of the entire chromatography analysis. The streamlined review and approval life cycle, deliveres a minimum 30% increase in turnaround efficiency.
The chromatography information is collated with other analytical & process data to enable visualization across the project or process.
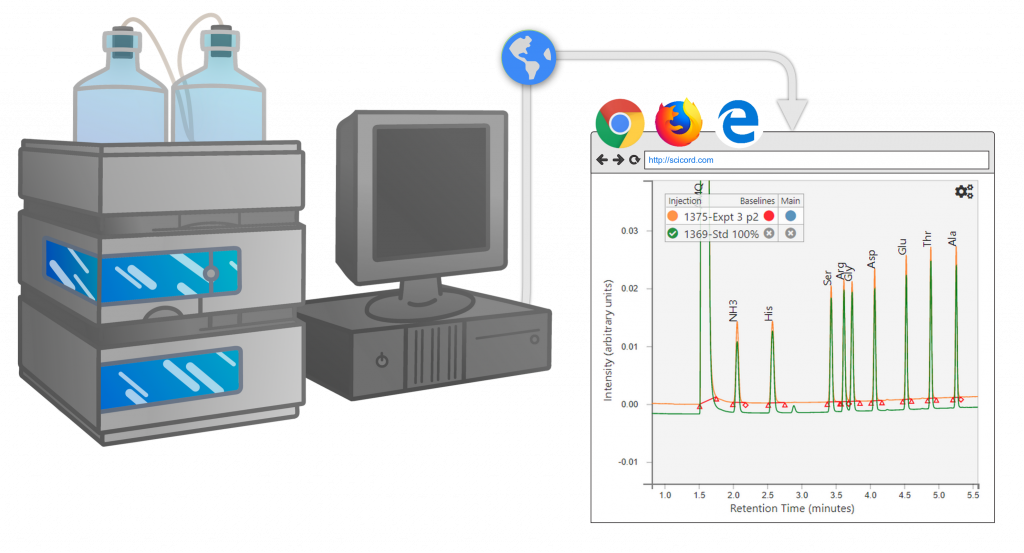
A browser based sequence viewer eliminates the need for reviewers, approvers and decision makers to access & navigate the chromatography system.
A simple, demo version of SciCord’s SciChrom Viewer is accessible below. A guide is also available if you need more information about how SciChrom Viewer works.
Quick Guide
Zoom/Pan Controls
Ctrl-Click or Middle-Mouse click to use the zoom-box
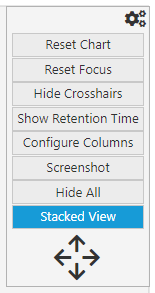
Options Panel
The options panel can be accessed by moving the mouse over the gear icon in the top right corner of the chart, or by right-clicking anywhere in the chart.
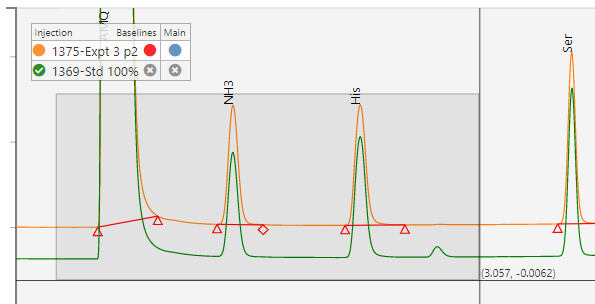
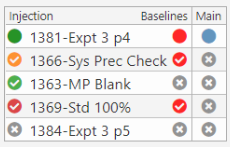
Legend
If there are one or more secondary injections, an additional column will be added to the legend called “Main”.
The legend can be moved around the chart by clicking and dragging it.
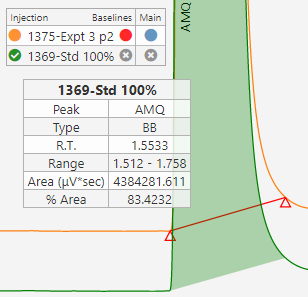
Peak Information
For a deeper dive into using SciChrom Viewer, the full user guide can be downloaded:
Full User Guide
Reach out to Schedule a Meeting and get more information about how SciCord can fit into your lab
Don’t take our word for it.
We exceed our client’s demands everyday to make their research and discovery process simpler and more efficient.
This is by far the best value in science software (or anything else in science, really) that we’ve ever experienced. Other solutions in this price range had a fraction of the features, and those with the features cost 3x – 10x more. We’re very happy customers.
Josh Guyer,
Senior Pharmaceutical Scientist
SCIENTIFIC RECORDING
info@scicord.com
8601 Six Forks Road, Suite 400, Raleigh, NC 27615
All product names, logos, brands and trademarks are property of their respective owners. All company, product and service names used in this web site are for identification purposes only.
Use of these names, logos, brands and trademarks does not imply endorsement or direct affiliation with SciCord, LLC.
The information contained herein is on an “as is” basis, without warranties or conditions of any kind, either express or implied, including, without limitation, any warranties or conditions of title, non-infringement, merchantability, or fitness for a particular purpose.
You agree that you will not rely on and are solely responsible for determining the appropriateness of using the information provided on this web site and assume any risks associated with doing so.
Copyright © 2012- SciCord LLC All Rights Reserved.
