[spacer]
[alt-row-flex][col-flex-5]

Inhalation

Improve control of your Inhaled development using an Information Platform to improve both compliance and efficiency

Contact Us

[/col-flex][col-flex-7]
Bring inhalation results to SciCord ELN
[/col-flex] [/alt-row-flex]

[spacer]

Balancing Lab Efficiency with IT and Compliance Requirements

Your inhaled teams contend with difficult manufacture processes, challenging test protocols and large data sets.
Help your teams automate and effectively manage the inhaled work with start-to-finish automation.

[spacer]
[card_row_flip] [card][style]min-height: 300px;[/style] [card_face]

Document Control

[/card_face][card_back] Document the entire development life-cycle across Development Studies, Manufacture Batch Records, Analytical Testing, Quality Control Testing, and all other aspects of a lab/manufacturing process.
[/card_back] [/card] [card][style]min-height: 300px;[/style] [card_face]

Error Reduction

[/card_face][card_back] Process and analytical information is recorded directly in the Informatics Platform – Right First Time. Guides and informs the entire work process by documenting the sequence of events and highlighting areas of inconsistency.
[/card_back] [/card] [card][style]min-height: 300px;[/style] [card_face]

Instrument Management and Interface

[/card_face][card_back] Instrument integrations with balances, chromatography, moisture, pH and more.

[/card_back][/card] [/card_row_flip]

[spacer-25]
Featured Contents
[spacer]
[alt-row-flex][col-flex-4.5]

[FA_icon]fas fa-check-square[/FA_icon] Right First Time

  • Work process templates, guide and inform the required process steps and assure comprehensive documentation.
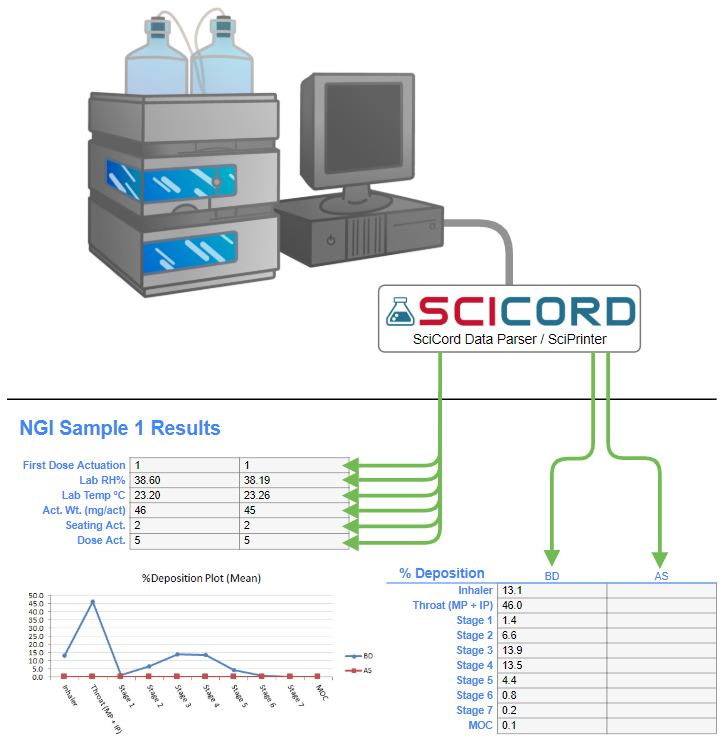
  • Interfaced instruments to eliminate transcription errors
  • Automated/validated calculations generate accurate reportable data, managing the required precision, and automatically updating when a contributing data point is recorded/corrected.
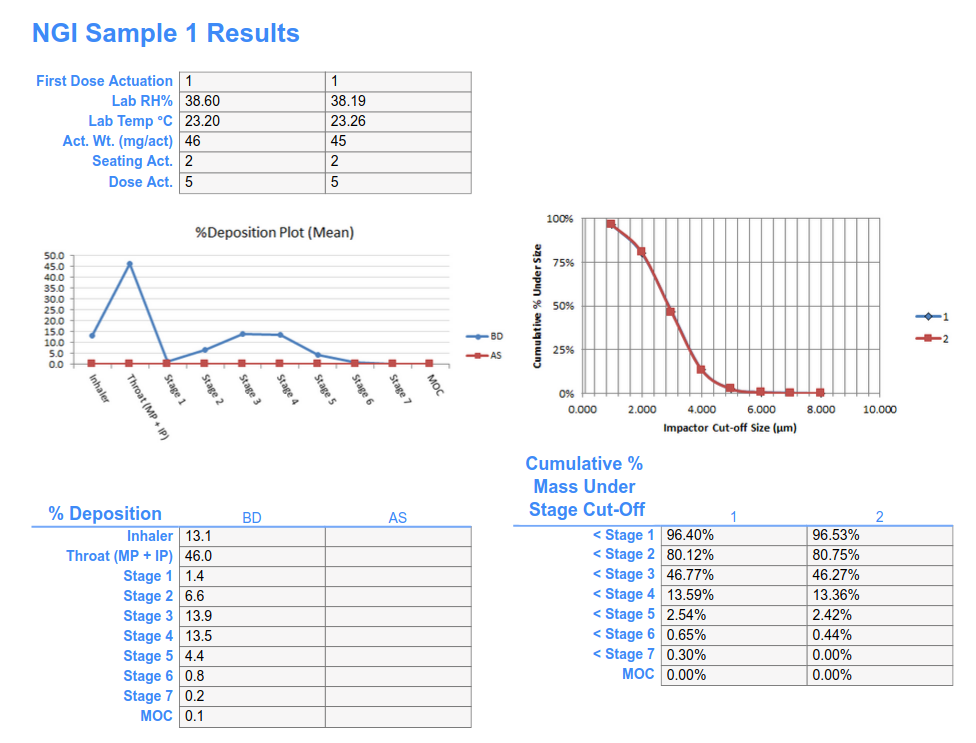
[/col-flex][col-flex-0.5] [/col-flex][col-flex-7] Inhalation results are organized and visualized automatically when imported from Empower (or other programs/manual entry if desired).
[/col-flex][/alt-row-flex] [spacer-25] [alt-row-flex]flipMobile[col-flex-6]
[/col-flex][col-flex-0.5][/col-flex][col-flex-5.5]

[FA_icon]fas fa-tasks[/FA_icon] Compliance

  • 21 CFR part 11 compliant, validated, and version-controlled spreadsheet templates.
  • Visual audit trail to easily track your notebook records and eliminate regulatory worries.
  • Electronic signatures for accountability and lifecycle decisions.
  • Optimized review & approval process increases productivity by 30%.
  • Your data is secure in Microsoft Azure and with cloud security and automatic backups.
[/col-flex][/alt-row-flex] [spacer-25] [alt-row-flex][col-flex-5]

[FA_icon]fas fa-check-square[/FA_icon] Decision Making

  • Visualized data lets analysts see the variability generated by changes in flow rates, spray patterns, through use, sample preps, test conditions, data transcription, and analyst techniques.
  • Visualization highlights anomalies in the analytical data, reduces the amount of effort required to identify their sources, and supports enhanced quality.
  • Address the unique difficulties encountered by labs testing DMDIs and DPIs and provide an efficient means to pinpoint anomalies, identify their sources, and provide better QC.
[/col-flex][col-flex-0.5] [/col-flex][col-flex-6.5]
[/col-flex][/alt-row-flex] [spacer-25] [alt-row-flex]flipMobile[col-flex-5.5]
[/col-flex][col-flex-0.5][/col-flex][col-flex-5.5]

[FA_icon]fas fa-file-alt[/FA_icon] Specialized Inhalation Templates

  • Off-the-shelf templates are available for: Aerodynamic Particle Size Distribution, Delivered Dose Uniformity, Water Content, Leakage, Number of Discharges, and more. Additional templates can be created by your team or in partnership with SciCord engineers.
  • Validated processes and calculations generate data you can be confident in.
  • Information recorded in the templates is automatically converted into structured data for visualizations & reporting
[/col-flex][/alt-row-flex]
  • Includes interface with instruments (balance, chromatography system, moisture meter, pH meter…) to generate run sequences, record instrument reports, and parse measurement data.
  • Manages complex sample preparations to increase measurement accuracy, reduce errors of transposition or substitution, with references to equipment, instruments, and reference standards, standards, and solutions.
[spacer-25] [alt-row-flex][col-flex-6.5]

[FA_icon]fas fa-weight[/FA_icon] Equipment & Instrument Management

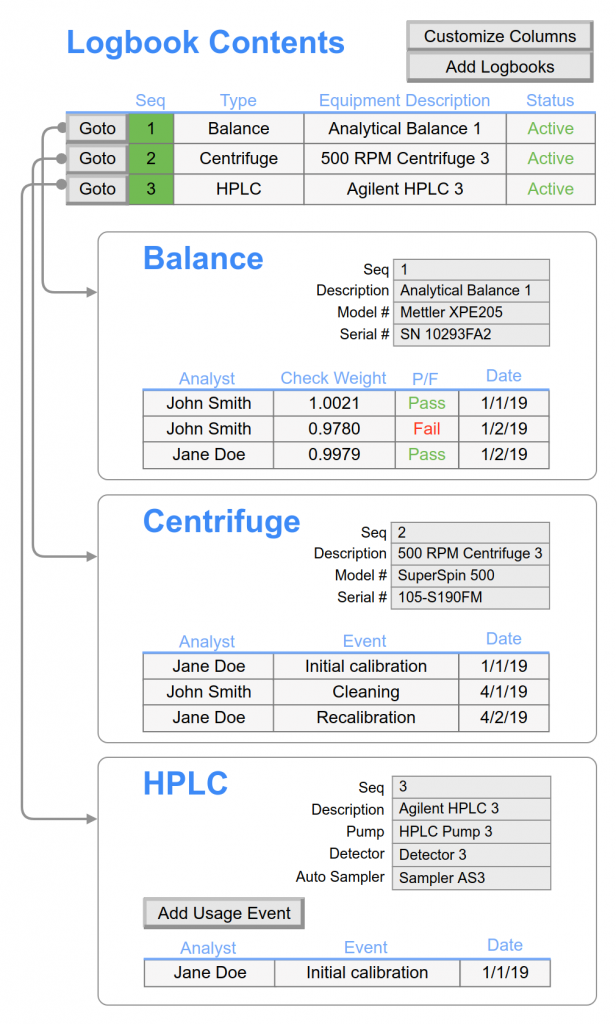
  • Electronically document equipment/instrument inventory.
  • Schedule calibration or maintenance events.
  • Record the details and attach vendor documentation for completed calibration or maintenance events.
  • Record daily instrument checks
  • Manage instrument interface parameters
  • Automatically log equipment use for usage reports or quickly identify instruments in investigations.
[/col-flex][col-flex-1] [/col-flex][col-flex-4.5] Multiple instruments and other equipment types can be logged in the same document
[/col-flex][/alt-row-flex] [spacer-25]

[FA_icon]fas fa-search[/FA_icon] Review

Optimized review process increases productivity by 30% over a paper based process.

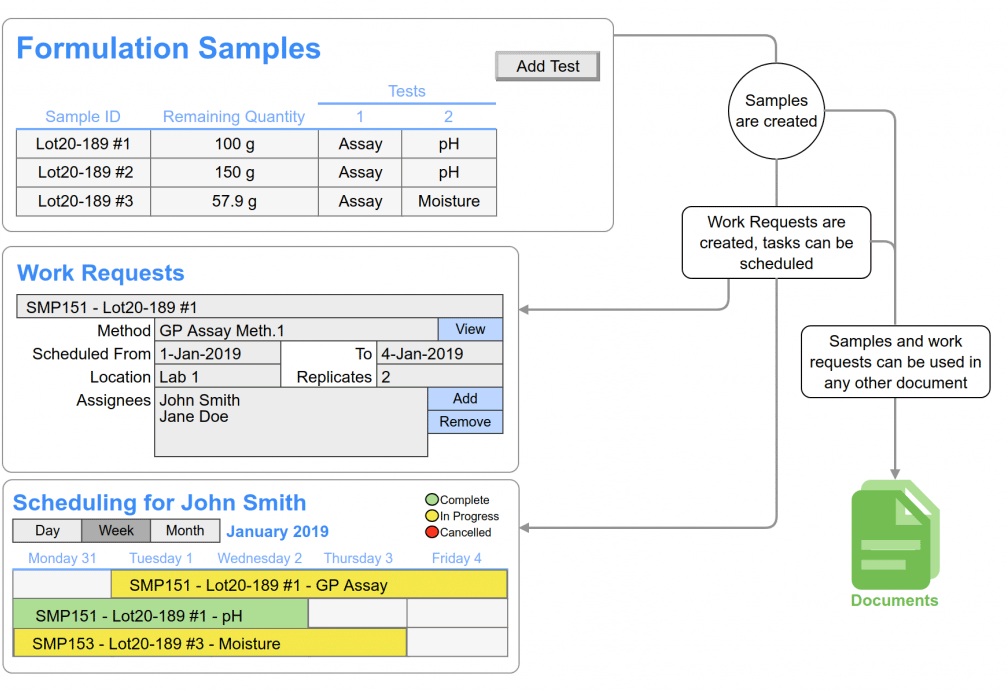
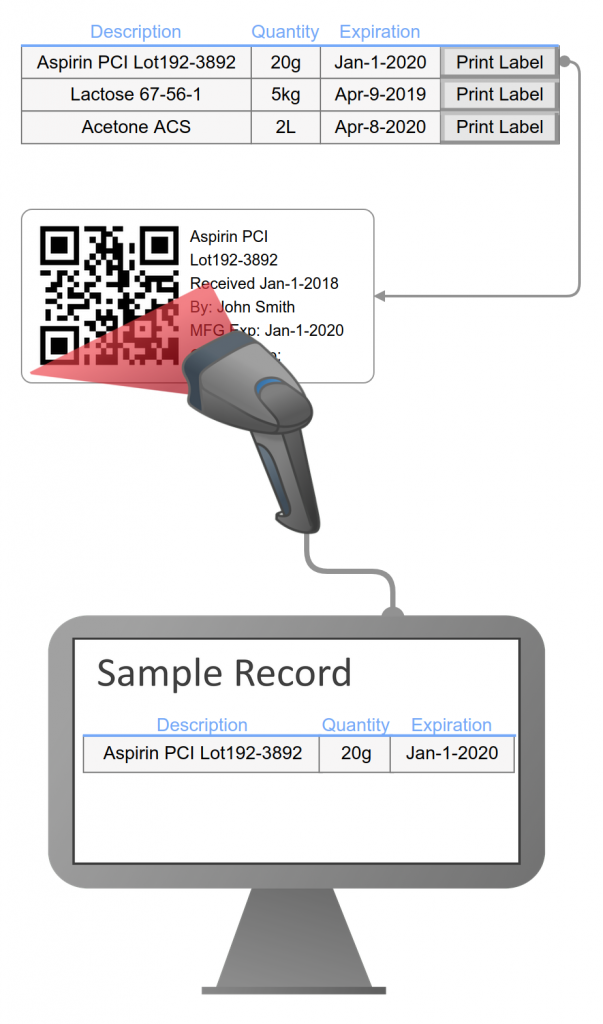
[spacer-25] [alt-row-flex]flipMobile[col-flex-4.5] ELN samples can be used to print a label for the physical sample, which can be scanned to retrieve its ELN record.
[/col-flex][col-flex-0.5][/col-flex][col-flex-7]

[FA_icon]fas fa-file-excel[/FA_icon] Spreadsheet Paradigm

  • Off-the-shelf templates are available for: Aerodynamic Particle Size Distribution, Delivered Dose Uniformity, Water Content, Leakage, Number of Discharges, and more. Additional templates can be created by your team or in partnership with SciCord engineers.
  • Validated processes and calculations generate data you can be confident in.
  • Information recorded in the templates is automatically converted into structured data for visualizations & reporting
[/col-flex][/alt-row-flex] [spacer-25]

[FA_icon]fas fa-table[/FA_icon] DataMart

Your process and analytical information collated in data tables specifically designed for the inhaled development team. SQL queries support easily integration with your existing statistical packages or visualization tools (Microsoft Excel®, Microsoft Power BI®, Tibco Spotfire®, SAS JMP®, etc.) for analysis and trending.

[spacer-25]

[FA_icon]fas fa-gavel[/FA_icon] 21 CFR

  • Validated, and version-controlled spreadsheet templates
  • Visual audit trail captures who did what, why, and when.
  • Electronic signatures for workflow and key process decisions.
[spacer-25]

[FA_icon]fas fa-chart-area[/FA_icon] Sequence Visualization

A browser based sequence viewer eliminates the need for reviewers, approvers and decision makers to access & navigate the chromatography system.

A simple, demo version of SciCord’s SciChrom Viewer is accessible below. A guide is also available if you need more information about how SciChrom Viewer works.
[popup_button][popup_button_number]1[/popup_button_number][FA_icon]fas fa-book-reader[/FA_icon] Quick Guide[/popup_button] [popup][popup_number]1[/popup_number]

Zoom/Pan Controls


[alt_row] [col-6]
  • The chart can be panned by left-clicking and holding anywhere in the chart and moving the mouse.
  • The chart can be zoomed by scrolling up or down on the scrollwheel, or by using a pinch to zoom gesture on touchscreens.
  • Ctrl-Clicking and dragging the mouse (or clicking down on the scrollwheel/middle mouse button and dragging) will create a zoom-box that will define the new pan and zoom of the chart.
    • If the zoom-box does not match the aspect-ratio of the original chart, the injection lines will be vertically stretched to fill the space. This can be used to enlarge small peaks.
[/col] [col-6]

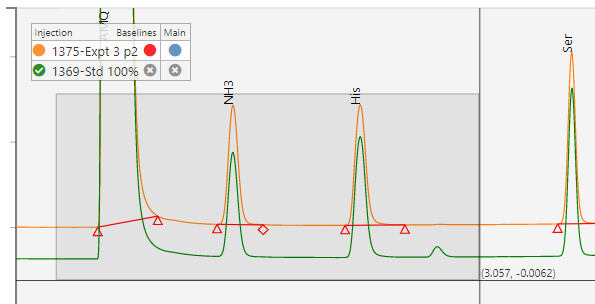
Ctrl-Click or Middle-Mouse click to use the zoom-box

Ctrl-Click or Middle-Mouse click to use the zoom-box

[/col] [/alt_row]

Options Panel


[alt_row] [col-9]

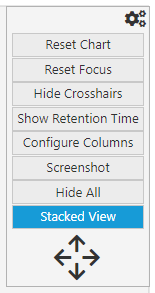
The options panel can be accessed by moving the mouse over the gear icon in the top right corner of the chart, or by right-clicking anywhere in the chart.

  • Reset Chart: redraws the chart from scratch, restores zoom and panning to default positions
  • Reset Focus: Resets the vertical scaling if the chart has been vertically stretched
  • Hide/Show Crosshairs: Hides or shows the crosshairs, button label changes contextually
  • Show/Hide Retention Time: Shows or hides the retention times on peak labels. The button label changes contextually
  • Configure Columns: Shows a popup dialog that allows you to select the visible columns in the peak table and set number of decimals
  • Screenshot: launches the screenshot dialog
  • Hide/Show All: Hides/Shows all secondary injections. Button label changes contextually.
  • Stacked/Normal View: Toggles the Stacked view on and off. Button label changes contextually.
    • If the button is grey and says “Normal View”, secondary injections will be drawn on top of the main injection
    • If the button is blue and says “Stacked View”, the secondary injections are given an offset to separate them out from the main injection and each other
      • Four arrows are available below the button to change this offset by moving the secondary injections up, down, left, or right.
[/col] [col-3]

ChromView options panel

[/col] [/alt_row]

Legend


[alt_row] [col-9]

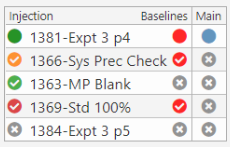
If there are one or more secondary injections, an additional column will be added to the legend called “Main”.

  • The circle icon to the left of the name of each secondary injection will be a colored check-mark. Clicking this icon will turn it into a grey X and hide the corresponding injection in the chart. All of the secondary injections can also be hidden/shown at once using the Hide/Show All button in the options panel.
  • The circle icon to the right of the name of each secondary injection will be a grey X. Clicking this icon will turn it into a red check-mark and will display the baselines on the corresponding injection.
  • The main injection will have a blue circle in the “Main” column, while the secondary injections will have a grey X. Clicking one of the grey Xs will make the corresponding injection the main injection and re-order the chart accordingly.

The legend can be moved around the chart by clicking and dragging it.

[/col] [col-3]

ChromView legend

[/col] [/alt_row]

Peak Information


[alt_row] [col-8]
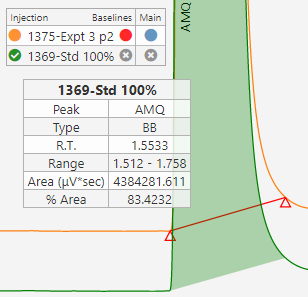
  • Clicking on a peak will highlight the peak in the chart.
    • A mini-table will also appear with relevant information about the peak.
  • The full table is located below the chart. Each row corresponds to a peak.
    • Clicking a row will also highlight the peak in the chart.
    • The visible columns can be configured in the options panel.
[/col] [col-4]

ChromView click peak


[/col] [/alt_row]

For a deeper dive into using SciChrom Viewer, the full user guide can be downloaded:
[FA_icon]fas fa-file-pdf[/FA_icon] Full User Guide

[/popup]

[spacer-25] If you want a more technical discussion about inhalation in general, you can read more here.
SPACER

Trusted by organizations of all sizes


SPACER

SPACER

What Our Users Say


SPACER

Don’t take our word for it. We exceed our client’s demands everyday to make their research and discovery process simpler and more efficient.


SPACER
“Not a day goes by where I don’t reflect on how much easier your system makes this job.”
“We have been audited by FDA twice and they had no concerns about the system nor any findings.”
– Deb Carr, Director, IPD
“The implementation was quite smooth. The team came onsite and worked in parallel with our IT team.”
“Really cool to have data and CofA in the same system. I’ve used other solutions which require access to multiple systems to get the full picture.”
– Radu Mihaila, Director CMC at GBT & Pfizer
“[After sales support is] consistently excellent. They respond quickly, investigate thoroughly, and they can explain everything in a way that we understand and can convey.”
“My experience with the entire team (US & Europe) has been amazing. They are just a phone call away. My work has never suffered because of the lack of the support from their team.”
-Indu Chowdhary, PhD
“In a head to head competition, SciCord was 3x more efficient at documenting a typical work process than [competition]. A complete ‘Assay’ work process required 60 minutes in [competition], while only 20 minutes in SciCord!”
“Very impressed with the Demo. We actually had a call with another vendor just after your demo and they didn’t have half of the capabilities that SciCord was able to show.”
“We can scale our production up to 40% thanks to [SciCord].”
“Other LIMS systems are more challenging to implement”
– Radu Mihaila, Director CMC at GBT & Pfizer


SPACER
SPACER
[alt-row-flex][col-flex-6.5]

Contact Us

Reach out to Schedule a Meeting and get more information about how SciCord can fit into your lab

Contact Us

[/col-flex][col-flex-5.5]
[/col-flex] [/alt-row-flex]