Documentation
Your Informatics Platform provides tools for documenting samples to be tested, referencing standards & solutions, recording instruments, columns, and methodology of the chromatography analysis.
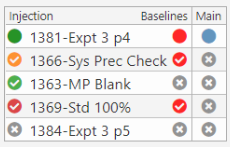
Sequence Creation
The injection sequence is defined by the Informatics Platform based on the type of analysis, compliance requirements, samples, standards, QCs … The injection sequence can be transferred to the chromatography system using various file formats or copy/paste.
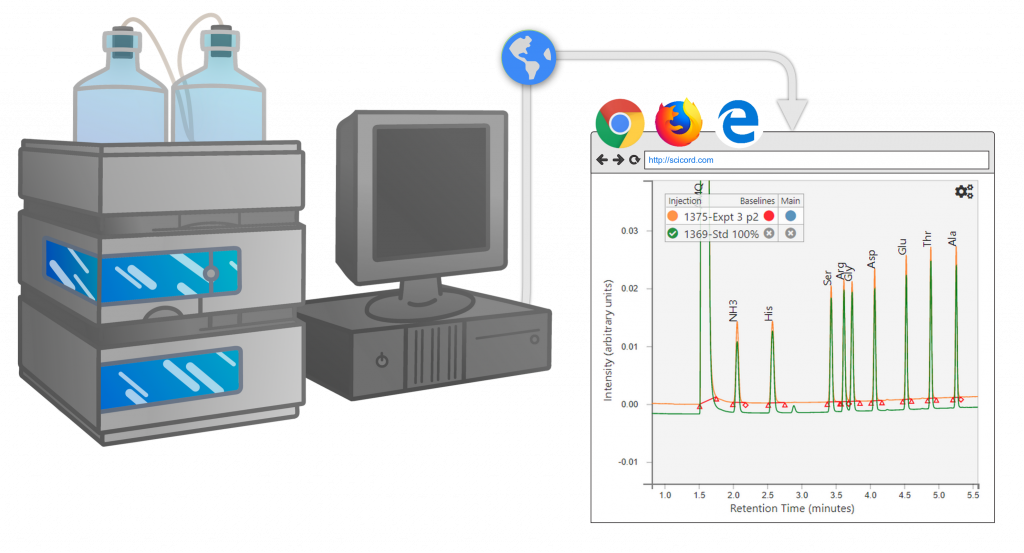
Integrated Data Import
Integrated sequence data is imported into the Informatics Platform through techniques dependent on vendor.
- XML or other structured file data source, like Agilent®
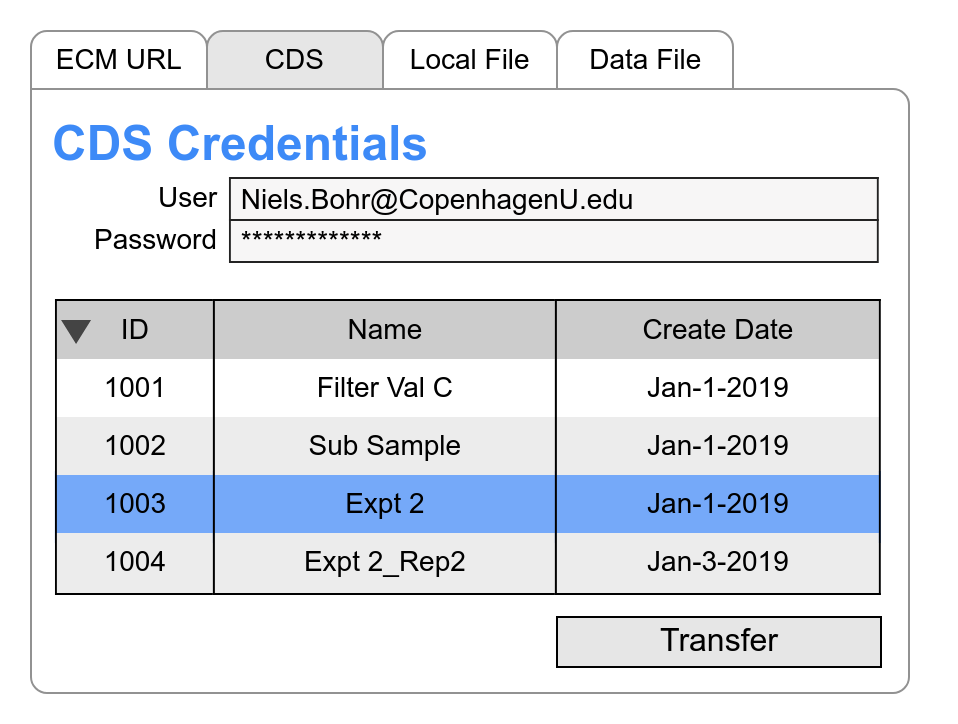
- Enterprise Content Management (ECM) systems may support interface through a secure URL which is a reference to the underlying XML or other structured file data source.
- Structured API to an underlying data source, like Empower®
The data import must match the chromatography system injections with Informatics Platform elements (samples & standards). Since sequence runs may be altered at run time, a flexible system of matching is essential to efficient operations.
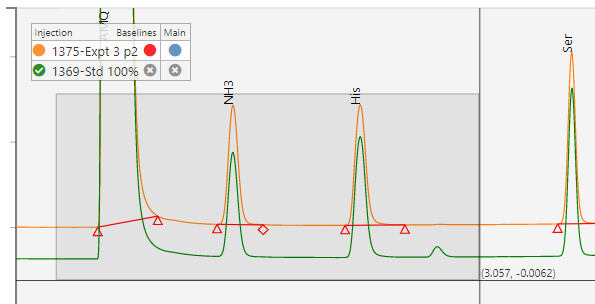
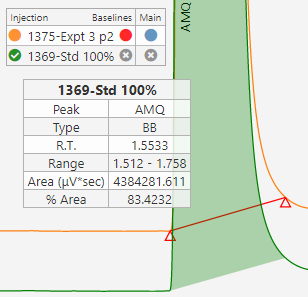
Data Reduction
Chromatography systems typically have calculation engines built in to calculate concentrations or other result from the underlying area count data. The Informatics Platform can perform additional validated calculations, data grouping, and suitability if necessary. The goal is to have all data reduction automated & validated.
Review and Approval
The Informatics Platform can provide comprehensive review and approval of the entire chromatography analysis. The streamlined review and approval life cycle, deliveres a minimum 30% increase in turnaround efficiency.